Timing Is Everything: Real S&P 500 Returns Across 5, 10, and 20-Year Windows
A century-long look at how entry timing shapes real, inflation-adjusted returns—proving that even long-term investing in the S&P 500 can yield wildly different outcomes.
Understanding the Data: The dataset spans from 1926 to 2024, covering a comprehensive period of 99 years—nearly a century—of financial history. The data presented are total returns, meaning they reflect not just price appreciation but also reinvested dividends. This approach closely mirrors the investment experience of holding an index fund similar to the S&P 500 over this extensive timeframe. Importantly, these returns are adjusted for inflation, reflecting real purchasing power.
Over this 99-year period, the S&P 500 generated a cumulative real return of 103,060%, meaning an investment grew to more than a thousand times its original value when adjusted for inflation. This remarkable growth corresponds to an annualized real return of approximately 7.3%, clearly illustrating the immense power of compounding. Additionally, the average annual real return during this period was 9.1%, while the median annual return stood higher at 11.7%, reflecting the presence of stronger returns in typical years.
You might think, "Great! I'll simply invest in the index and enjoy the ride." Unfortunately, the reality isn't quite that straightforward—the journey is often far from smooth. Depending on your timing, you may feel like an investment genius or an unlucky gambler. The difference between success and frustration frequently hinges on luck—specifically, the moment you enter and exit the market.
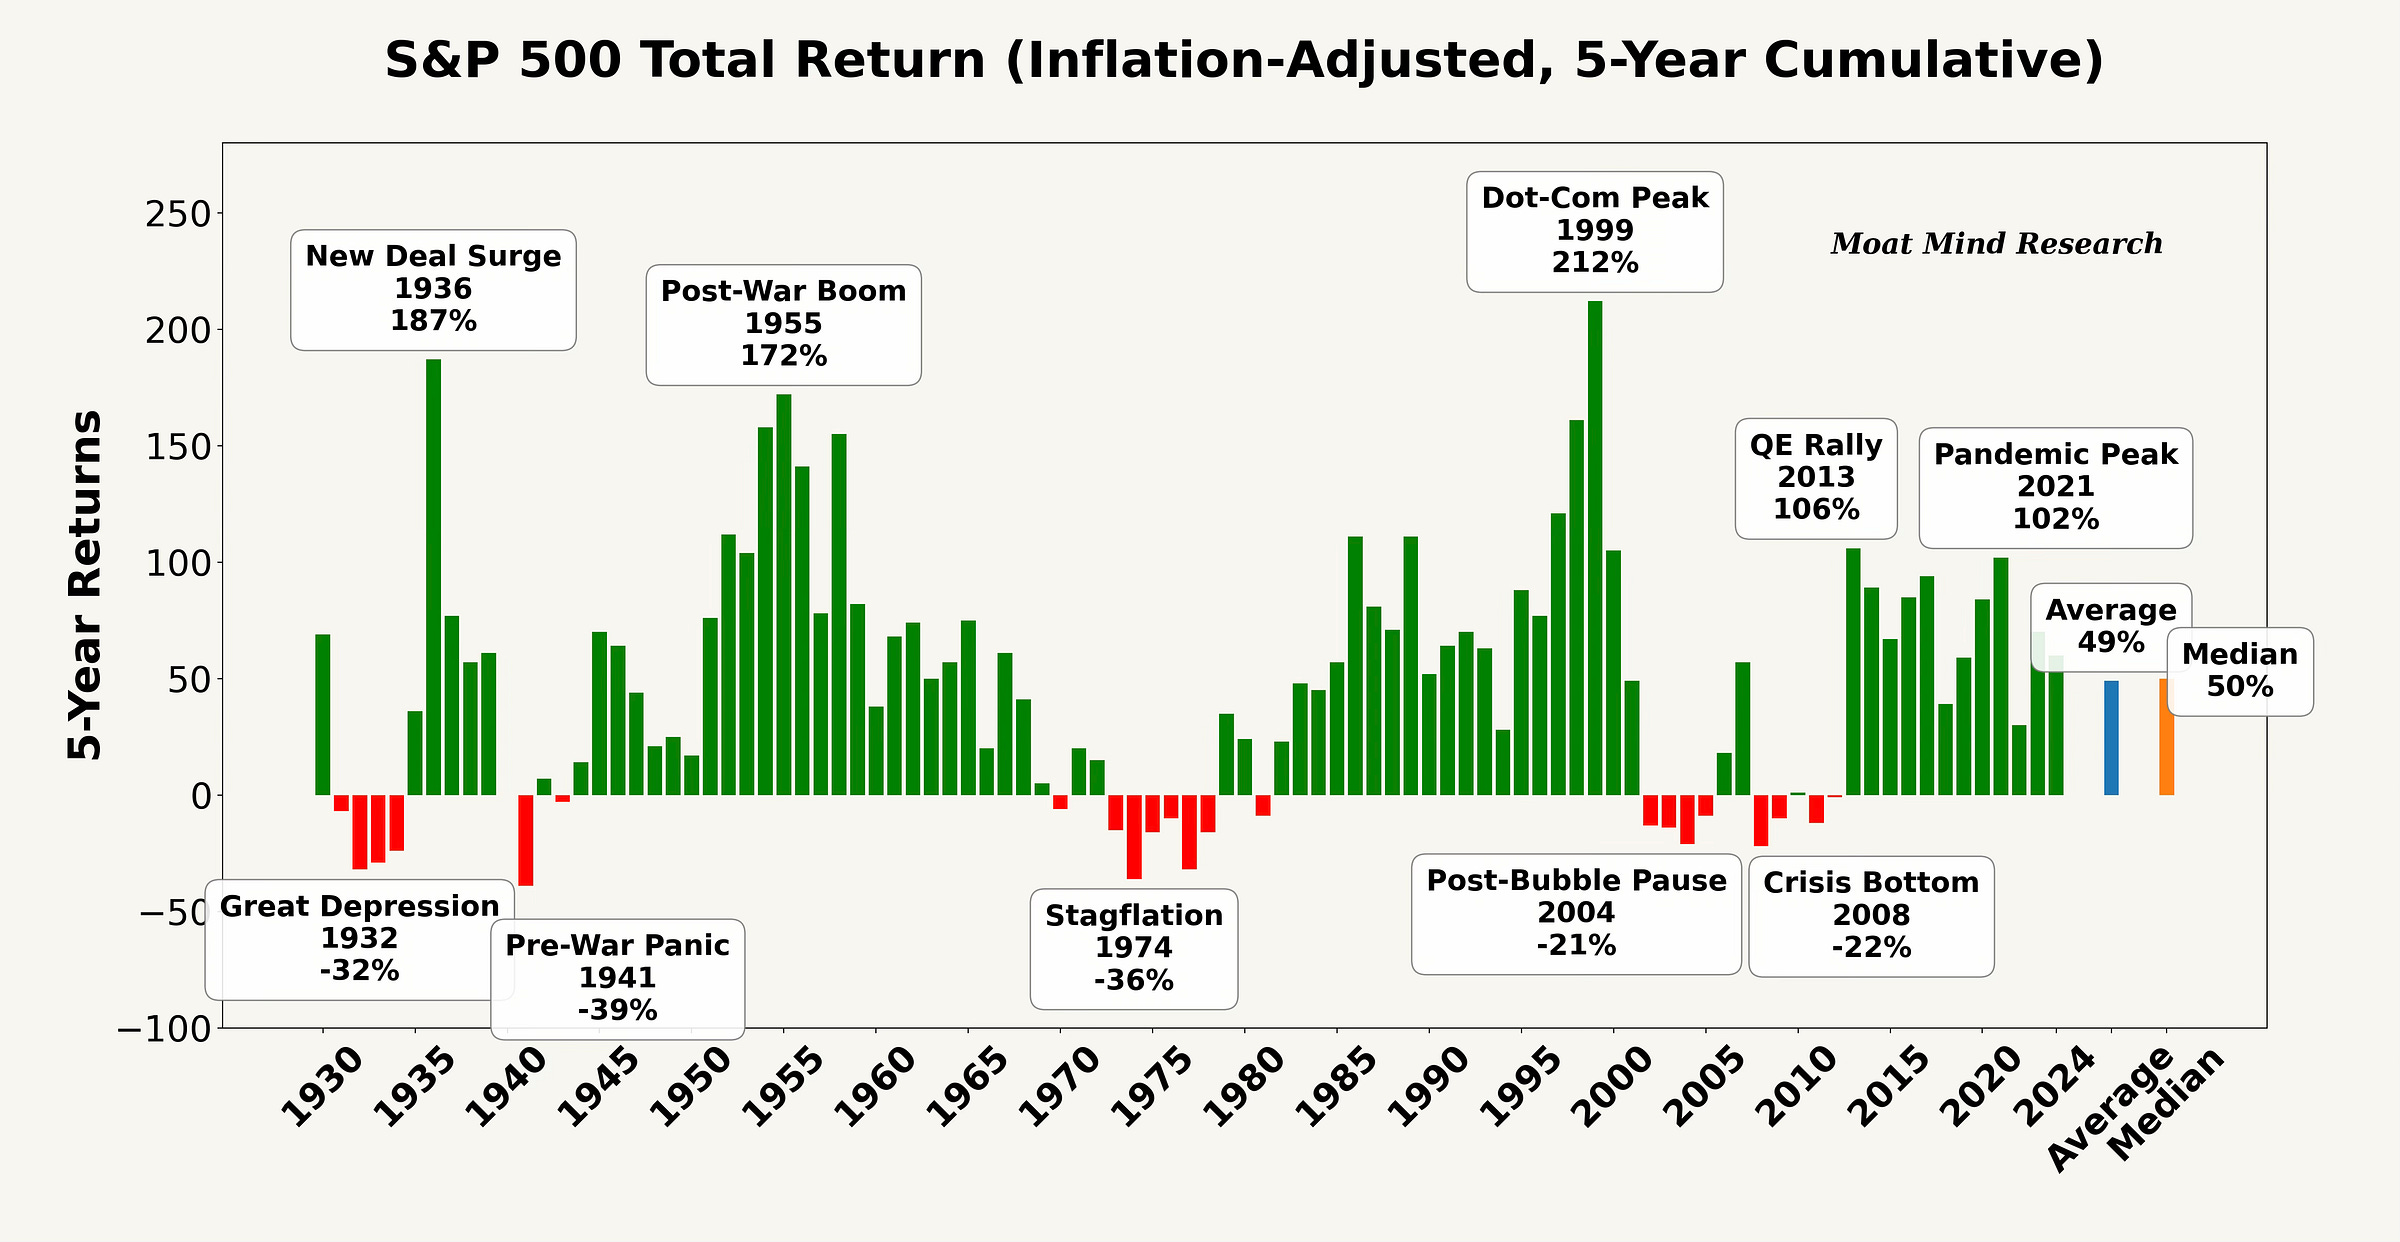
Let's begin by examining some of the most fortunate and unfortunate periods, starting with 5-year windows.
If you were invested in the S&P 500 during the most fortunate 5-year windows—specifically 1932–1936 (New Deal Surge), 1951–1955 (Post-War Boom), or 1995–1999 (Dot-Com Peak)—you nearly tripled your investment in real terms. These periods, driven by strong economic recoveries and booming market conditions, provided exceptional returns for investors.
On the other hand, timing wasn't always favorable. Investors caught during challenging 5-year periods—such as 1928–1932 (Great Depression), 1937–1941 (Pre-War Panic), and 1970–1974 (Stagflation)—lost roughly one-third of their purchasing power. Additionally, the periods of 2000–2004 (Post-Bubble Pause) and 2004–2008 (Crisis Bottom) individually saw less severe losses around 20%; however, experiencing these losses consecutively made the entire decade particularly painful. This brings us naturally to examining longer-term 10-year investment horizons.
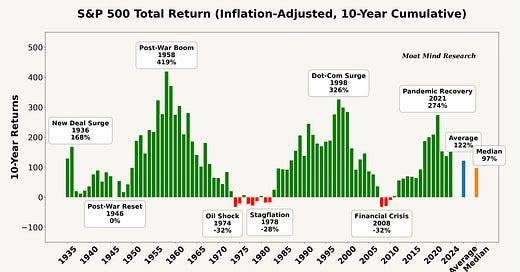
Looking at 10-year investment horizons further highlights how dramatically timing can impact your outcomes. Investors who entered the market at particularly fortunate times—such as 1949–1958 (Post-War Boom), 1989–1998 (Dot-Com Surge), or 2012–2021 (Pandemic Recovery)—saw their investments multiply three to five times in real terms, reflecting substantial periods of economic prosperity.
However, those who invested during especially challenging 10-year periods faced prolonged frustration. Notably, the periods spanning 1965–1974 (Oil Shock), 1969–1978 (Stagflation), and 1999–2008 (Financial Crisis) resulted in significant setbacks, with investors losing roughly 30% of their purchasing power over a full decade. These extended downturns highlight that even a 10-year commitment doesn't always guarantee a smooth ride or positive returns.
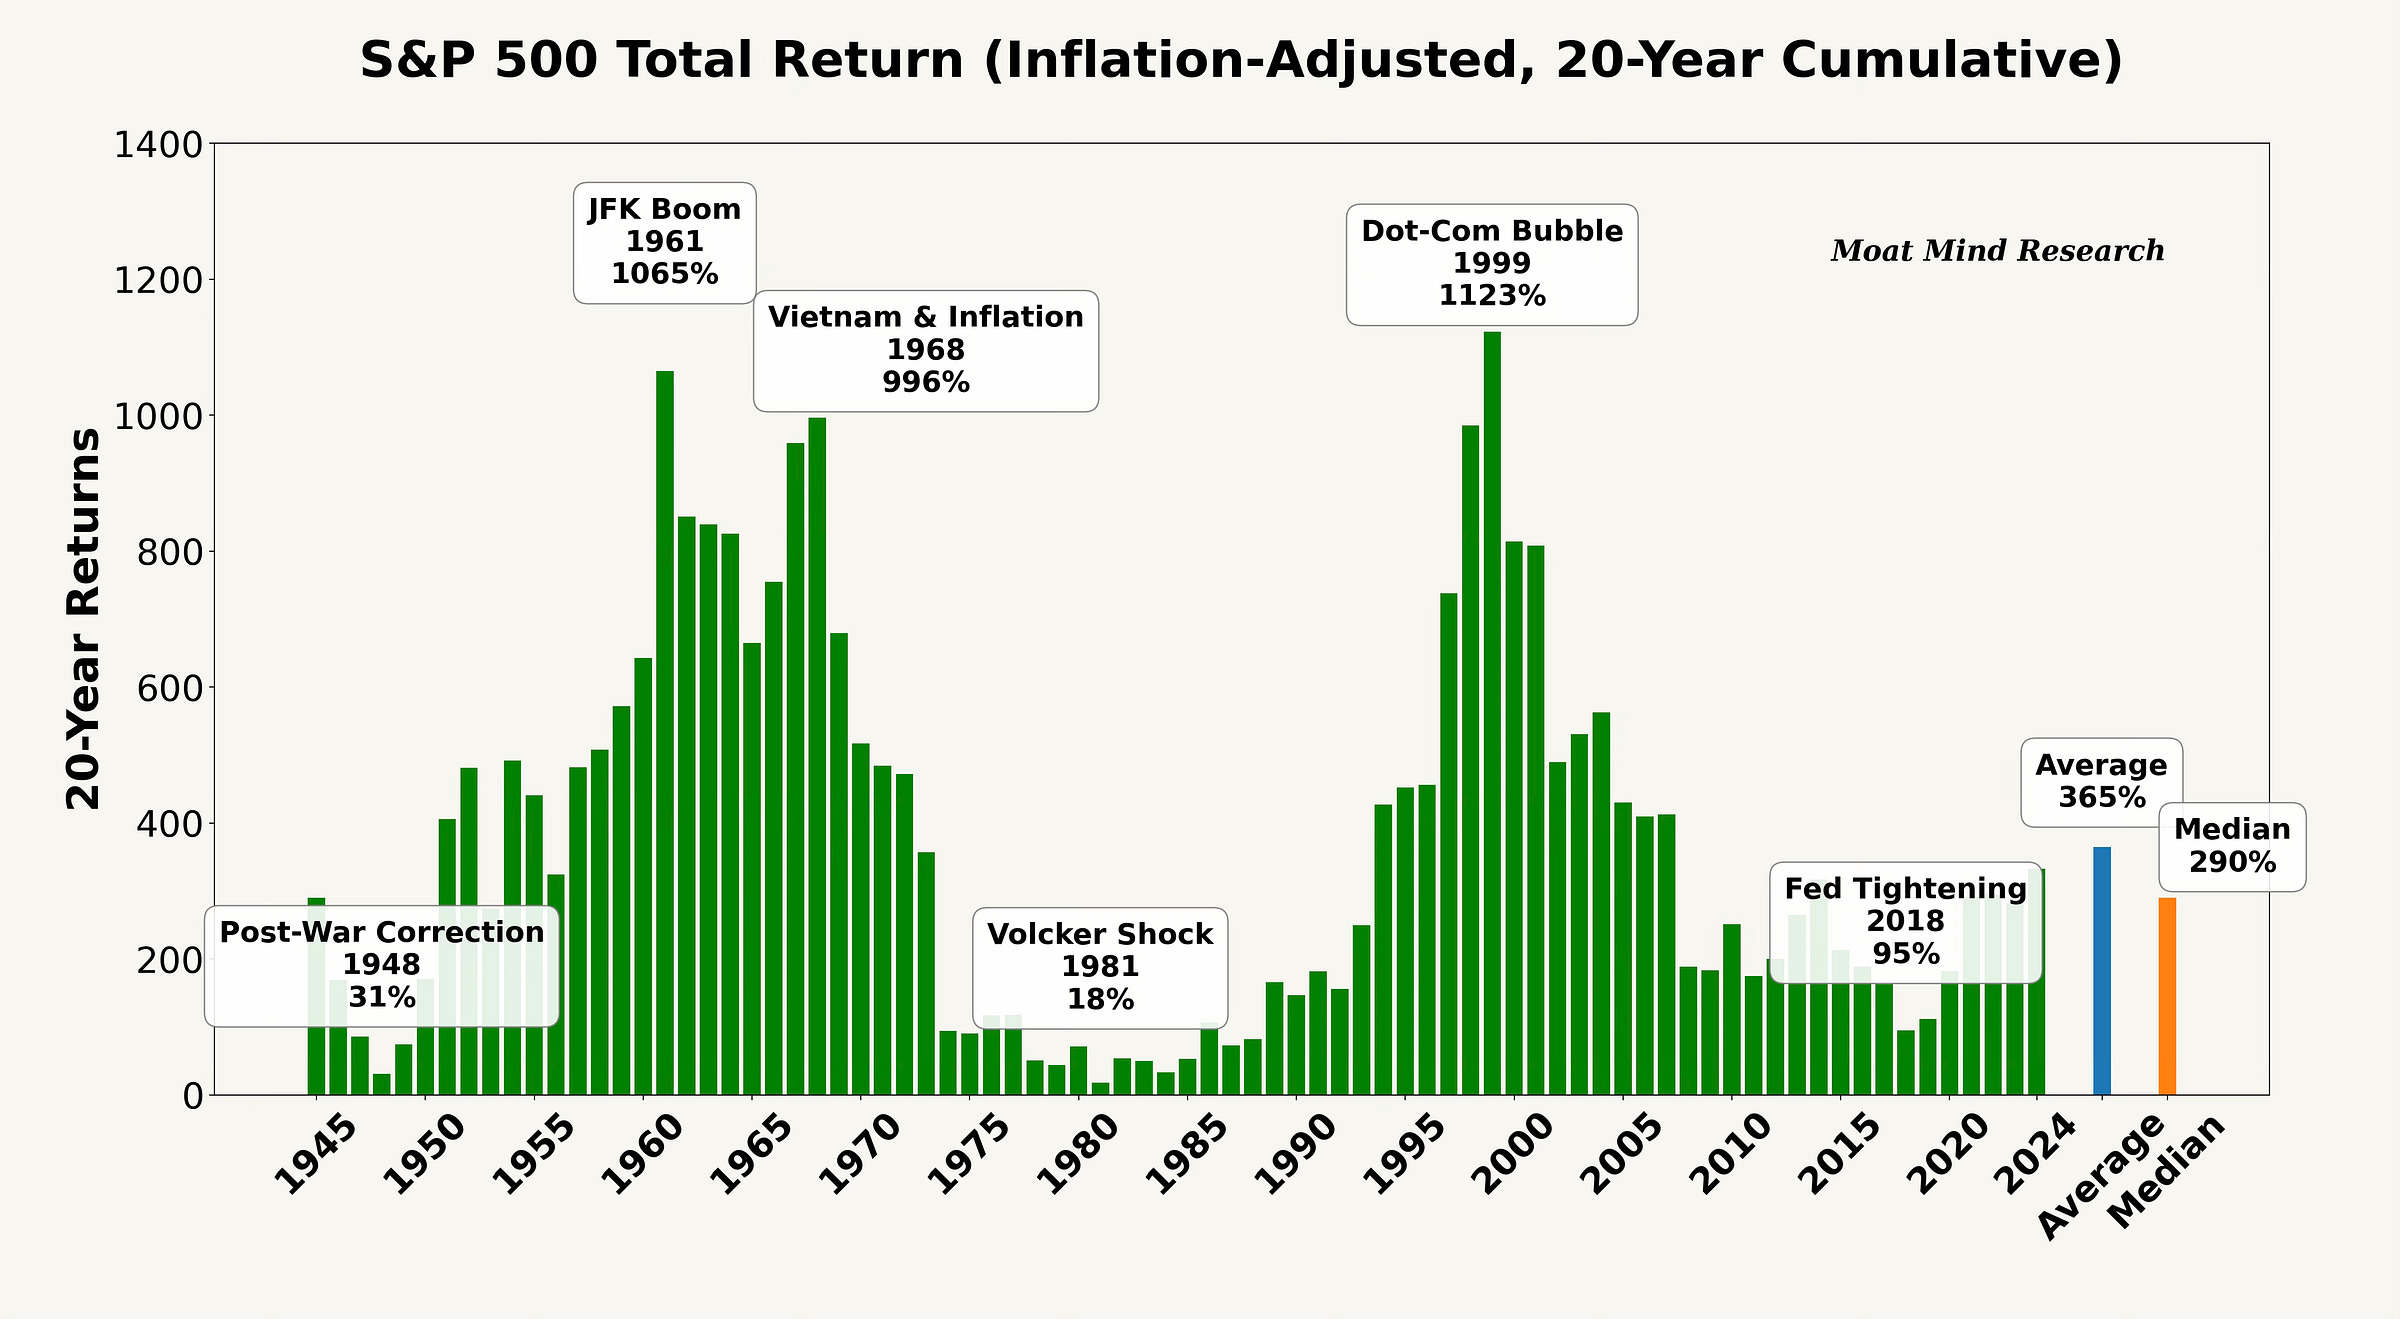
When we extend our perspective to a 20-year investment horizon, the power of compounding becomes even more apparent. Investors who entered the market during exceptional periods—such as 1942–1961 (JFK Boom), 1949–1968 (Vietnam & Inflation), or 1980–1999 (Dot-Com Bubble)—experienced extraordinary growth, increasing their investments approximately tenfold in real terms.
However, even over two decades, returns weren't always robust. Certain periods provided minimal gains in purchasing power, effectively resulting in stagnant growth. For instance, the windows from 1929–1948 (Post-War Correction)and 1962–1981 (Volcker Shock,) delivered almost nothing in real terms—surprisingly low considering the 20-year timeframe. Similarly, the more recent period from 1999–2018 (Fed Tightening) was relatively disappointing, yielding returns significantly below the historical average. These examples clearly illustrate how critical timing remains, even across lengthy investment horizons.
That's all for today from Moat Mind Research! 📘


Good article. Trying to time the market is always a weak approach.
how about dollar-cost averaging for these periods?