


The Ultimate Valuation Guide: Discounted Cash Flow (DCF) to Internal Rate of Return (IRR)
The Ultimate Guide to Evaluating Public Companies: From Discounted Cash Flow to Implied Rate of Return—A Smarter Approach to Valuation

Valuing public companies is both an art and a science, and like many investors, I initially turned to Discounted Cash Flow (DCF) due to its widespread use in valuation. However, as I worked through its assumptions, I found that small tweaks in inputs—growth rates, discount rates, or terminal values—could drastically change the outcome. This led me to question whether there was a more robust, comparative approach.
That’s when I began favoring the Implied Rate of Return (IRR). By reversing the DCF equation and solving for the discount rate that justifies the current market price, IRR provides a more intuitive way to assess investment attractiveness. But even IRR isn’t perfect. I kept refining my approach, exploring how to make it more practical and less sensitive to subjective assumptions.
In this post, I’ll take you through key insights I’ve gathered—step by step—culminating in a valuation framework that balances precision with practicality.
Key Insights
DCF has too many parameters—Tweak them slightly, and a stock can appear either significantly undervalued or severely overpriced.
Forget absolute valuation—What matters is having a consistent method to compare different investment opportunities.
WACC (Weighted Average Cost of Capital) —Often more of an academic exercise than a practical tool, it tends to overcomplicate valuations.
Reverse-engineering DCF—Since we know the current stock price, estimating free cash flow becomes the key input. Solving for 'r' in the DCF formula gives us the Implied Rate of Return (IRR)—a powerful metric for comparing investments.
Use the perpetual growth model for terminal value (future value of a business beyond the forecast period) —Multiples rely on a future buyer’s willingness to pay, while a perpetually profitable business doesn't need one.
If you can't reduce parameters, minimize their impact—Simplifying valuation isn't always possible, but ensuring parameters don’t disproportionately skew results is a solid alternative.
Define your time horizon wisely—The terminal value and forecast period are critical variables that must be carefully considered.
Cap growth forecasts at 10 years—Even this is ambitious. Beyond a decade, assume growth will only match inflation or economic expansion (~0% real growth).
Terminal value matters less with conservative assumptions—As IRR increases and growth rates decline, the weight of terminal value in total DCF shrinks. Use this as a sanity check to maintain realistic valuations.
IRR enhances comparability—Shifting focus from traditional DCF to IRR gives investors a more intuitive and comparable measure of investment attractiveness—one that avoids unnecessary complexity while maintaining analytical rigor.
Key Insight 1: DCF has too many parameters—Tweak them slightly, and a stock can appear either significantly undervalued or severely overpriced.
Small tweaks to key assumptions—such as growth rates, discount rates, or terminal value—can significantly impact the final valuation. For instance, using a lower discount rate makes a stock appear cheaper, while a higher one can make it seem overvalued. Additionally, since terminal value often represents the largest portion of a DCF calculation, the overall valuation is often more influenced by long-term assumptions rather than the company’s near-term free cash flow. This means that rather than reflecting the business’s current fundamentals, the final valuation largely depends on how you estimate its distant future. A mere 1% change in the discount rate can alter DCF valuations by 10-20%, demonstrating the model's extreme sensitivity to input parameters. Here you can see details:
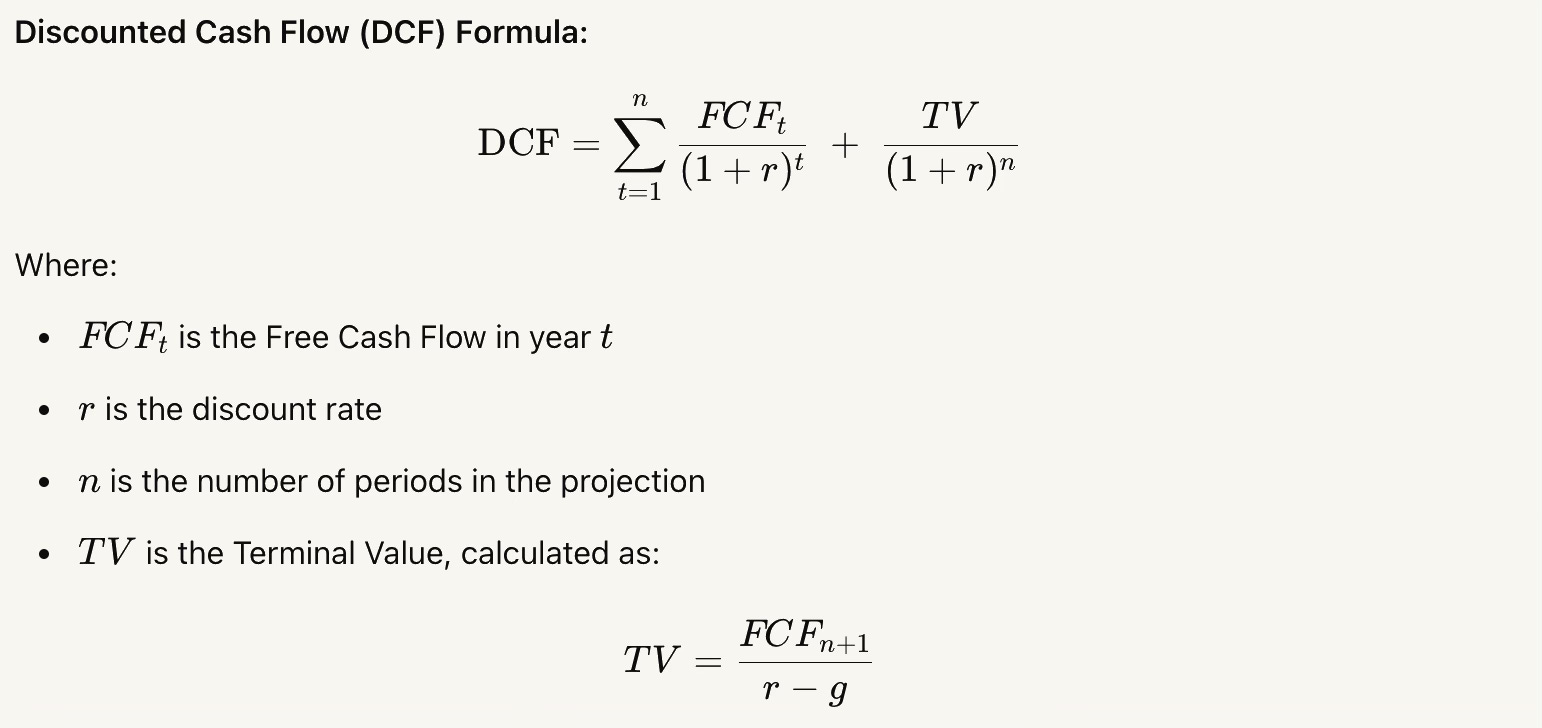
Discounted Cash Flow (DCF) Analysis
DCF is used to estimate the intrinsic value of a stock based on projected future cash flows.
How It Works:
Project Future Free Cash Flows (FCF) – Estimate the company’s FCF over a specific forecast period (usually 5-10 years).
Apply a Discount Rate (WACC or Required Return) – Discount future cash flows to present value using the Weighted Average Cost of Capital (WACC) or a required rate of return.
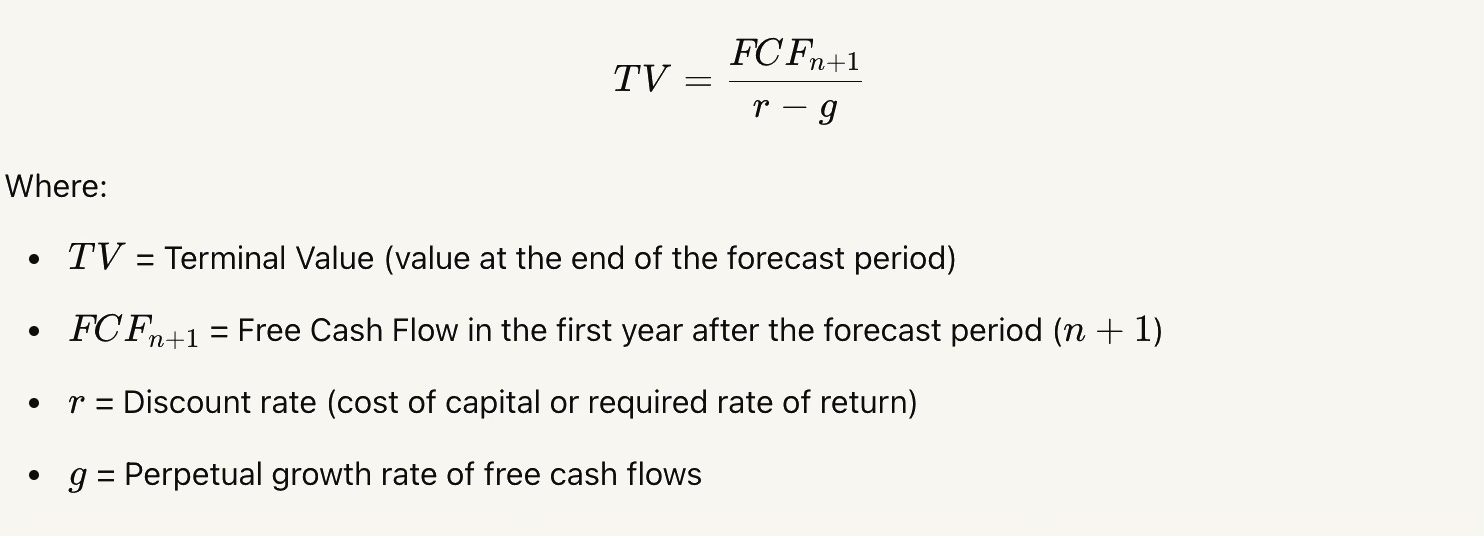
Calculate Terminal Value (TV) – Since businesses don’t just stop after 10 years, estimate the company’s value beyond the forecast period using a terminal growth rate.
Sum the Present Values – The present value of projected cash flows and the present value of the terminal value are added together.
Adjust for Debt & Shares Outstanding – Subtract net debt and divide by the number of shares to get the per-share intrinsic value.
Key Insight 2: Forget absolute valuation—What matters is having a consistent method to compare different investment opportunities.
One of the common pitfalls in investing is the search for a perfect absolute valuation number (e.g., a theoretically “correct” intrinsic value per share). In reality, no valuation method can precisely capture all the complexities and future uncertainties of a company’s performance. What does matter, especially for investors comparing numerous stocks or projects, is using a consistent valuation framework. This framework need not deliver a single bulletproof fair value; rather, it should reliably let you compare multiple opportunities and discern which offers the better risk-reward potential.
Key Insight 3: WACC (Weighted Average Cost of Capital) is overrated—Often more of an academic exercise than a practical tool, it tends to overcomplicate valuations.
WACC (Weighted Average Cost of Capital) is frequently used as a discount rate in DCF models, but it can be more of an academic concept than a practical tool. Here’s why:
Hard to Pin Down: Estimating cost of equity (via CAPM), cost of debt, and capital structure involves subjective assumptions that can swing WACC significantly.
Sensitive to Small Changes: Minor tweaks to beta or the equity risk premium can drastically alter the discount rate, overpowering other, more fundamental analyses.
Ignores Different Business Risks: A single WACC doesn’t reflect varying risks across divisions, leading to potential misvaluation.
Market Noise: WACC relies on market-driven metrics (like beta), which can fluctuate with short-term sentiment rather than long-term fundamentals.
Simpler Alternatives: Some investors prefer using historical returns on capital, cost of debt plus a risk spread, or an implied required return—approaches that often prove more stable and practical.
Key Insight 4: Reverse-engineering DCF—Since we know the current stock price, estimating free cash flow becomes the key input. Solving for 'r' in the DCF formula gives us the Implied Rate of Return (IRR)—a powerful metric for comparing investments.
In a standard DCF analysis, you guess a discount rate (r) and project free cash flows to arrive at a target stock price. But if you already know the current stock price, you can flip the process: estimate the future free cash flows, plug them into the DCF formula, and solve for r. This resulting implied rate of return (IRR) shows what return investors seem to be pricing into the stock right now.
From there, comparing the IRR among different companies or with your own required return helps you see which investments offer better potential returns—without having to arbitrarily pick a discount rate. By focusing on free cash flow forecasts and letting the price tell you the return, you get a practical yardstick for comparing opportunities on equal footing.
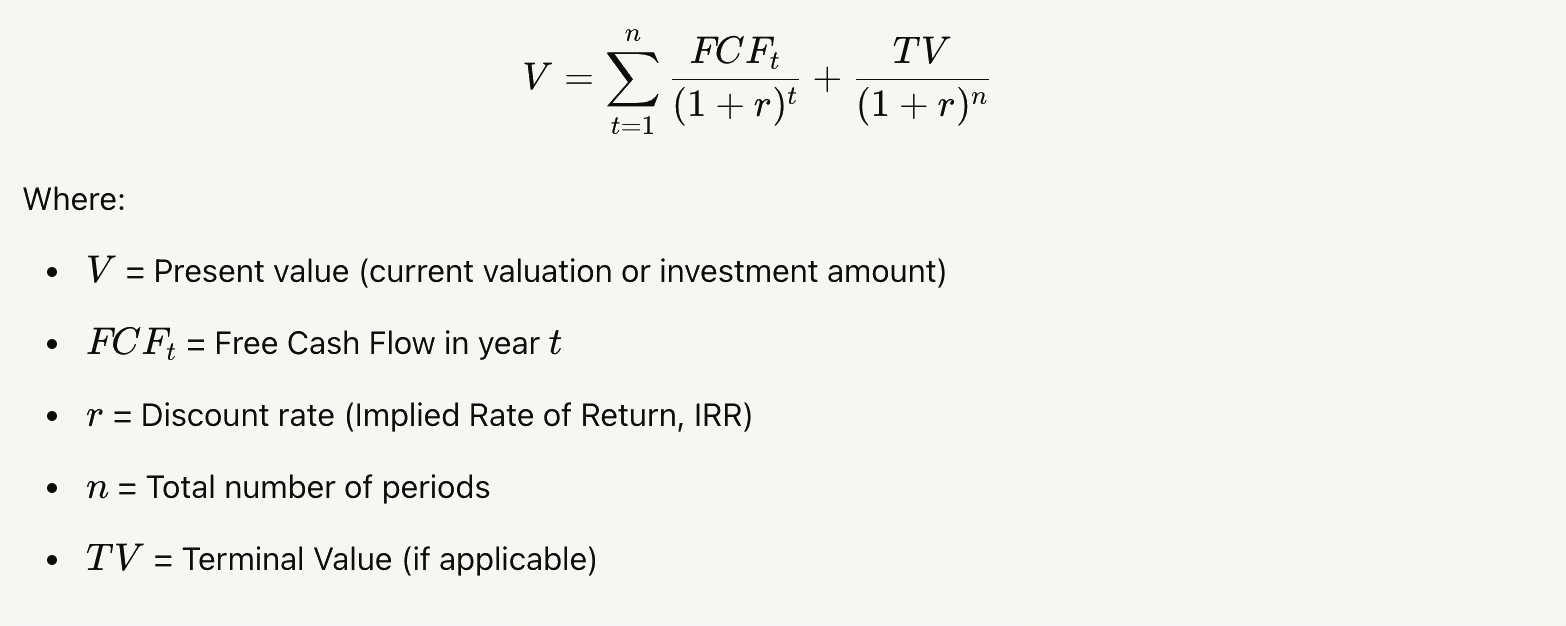
Implied Rate of Return (IRR) Analysis
The Implied Rate of Return (IRR) is a valuation approach that helps investors assess the expected return of an investment based on its current market price and projected future cash flows. Instead of assuming a fixed discount rate (like in traditional DCF), IRR solves for the rate of return that equates the present value of future cash flows to the current stock price.
How It Works:
Estimate Future Free Cash Flows (FCF) – Project the company’s free cash flows over a specific forecast period (typically 5-10 years).
Include Terminal Value (TV) – Since businesses don’t just stop after the forecast period, estimate the company’s long-term value beyond that using a perpetual growth rate or an exit multiple.
Set the Current Stock Price as the Present Value – Instead of assuming a discount rate, use the stock's current price as the sum of all discounted future cash flows.
Solve for the Discount Rate (r) – Find the discount rate that makes the sum of all discounted cash flows equal to the current market price. This rate is the Implied Rate of Return, representing the market's expected return for holding the stock.
Implied Rate of Return (IRR) Formula:
Why It Matters:
Market-Based Valuation – Instead of assuming an arbitrary discount rate (like WACC), IRR tells us the return the market is pricing in.
Easy Comparisons – Investors can compare the IRR of different stocks against their required return to determine if an investment is attractive.
Less Prone to Manipulation – Unlike DCF, which is highly sensitive to discount rate assumptions, IRR is anchored to market pricing, making it a more practical decision-making tool.
By using Implied Rate of Return, investors can reverse-engineer the market's expectations and determine whether a stock offers a compelling return relative to their own investment criteria.
Key Insight 5: Use the perpetual growth model for terminal value (future value of a business beyond the forecast period)—Multiples rely on a future buyer’s willingness to pay, while a perpetually profitable business doesn't need one.
Using the perpetual growth model for terminal value assumes the company continues operating profitably forever, growing at a modest, sustainable rate (often at or near long-term GDP or inflation levels). This approach avoids depending on a hypothetical buyer who would pay a certain multiple 10 years from now. In contrast, an exit multiple method essentially bets on future market sentiment. If the business is truly self-sustaining, a perpetual model better captures its intrinsic, ongoing value.
Key Insight 6: If you can't reduce parameters, minimize their impact—Simplifying valuation isn't always possible, but ensuring parameters don’t disproportionately skew results is a solid alternative.
This means precisely that you acknowledge the need for multiple inputs—growth rates, discount rates, margins, terminal value assumptions—but you tighten, cross-check, and sensitize them so that no single assumption (particularly the long-term growth rate or the terminal value component) can singlehandedly make or break your valuation. This results in a more balanced DCF model with realistic IRRs, improving both credibility and decision-making reliability. This lead us to Key Insight 7.
Key Insight 7: Define your time horizon wisely—The terminal value and forecast period are critical variables that must be carefully considered.
Defining the forecast period (how many years you project) and the terminal value (the value of the business after the forecast period) is critical because the terminal value often drives the majority of a company’s valuation. Choose a forecast that realistically captures growth (longer for high-growth firms, shorter for mature companies), and ensure your terminal value assumptions—whether via perpetuity growth or exit multiples—are realistic and align with the firm’s long-term outlook. These choices are “free variables,” so handle them thoughtfully and verify with industry norms and sensitivity checks. This lead us to Key Insight 8 and Key Insight 9.
Key Insight 8: Cap growth forecasts at 10 years—Even this is ambitious. Beyond a decade, assume growth will only match inflation or economic expansion (~0% real growth).
Forecasting more than 10 years into the future is inherently unreliable due to uncertain economic cycles, technological shifts, and changing competitive landscapes. Consequently, many valuation practitioners cap detailed projections at around a decade. Beyond that, they assume the company’s growth simply tracks inflation or overall economic trends—resulting in roughly 0% real growth.
Key Insight 9: Terminal value matters less with conservative assumptions—As IRR increases and growth rates decline, the weight of terminal value in total DCF shrinks. Use this as a sanity check to maintain realistic valuations.
When it’s not possible to eliminate complexity (i.e., reduce the number of valuation parameters), you can still limit their impact on the final valuation. For instance, using higher discount rates (like 15%) and lower growth assumptions (0%) reduces the share of total value coming from the terminal value (TV). A 15% discount rate and 0% growth yield only about 25% of total value from TV, whereas a 5% discount rate and 5% growth push that figure above 65%. In practical terms, a higher discount rate penalizes distant cash flows more, reducing reliance on the terminal value. Meanwhile, a lower (or zero) growth rate means fewer gains in later years, also shrinking TV’s influence. This keeps uncertain long-term assumptions from dominating the overall valuation, making results more robust to forecasting error.
Insight 10: IRR enhances comparability—Shifting focus from traditional DCF to IRR gives investors a more intuitive and comparable measure of investment attractiveness—one that avoids unnecessary complexity while maintaining analytical rigor.
Why IRR Enhances Comparability for Stocks
Single, Intuitive Percentage
The IRR for a stock can be understood as the annualized rate of return that sets the net present value (NPV) of its future cash flows (such as dividends and eventual sale proceeds) to zero.
Expressing potential returns as a single percentage rate is more intuitive than providing an absolute dollar figure. Instead of “Stock A has an NPV of $10,000, while Stock B’s NPV is $12,000,” you can say “Stock A yields 14% IRR, and Stock B yields 16% IRR.”
Straightforward Cross-Stock Comparisons
When comparing multiple stocks—especially those with different dividend yields, growth prospects, or holding periods—IRR puts them on a common scale.
Investors can quickly rank stocks based on the IRR without wading through overly complex multi-year cash flow models or adjusting discount rates for each.
Avoiding Unnecessary Complexity
Traditional valuation (Discounted Cash Flow) requires selecting a specific discount rate (e.g., using the Capital Asset Pricing Model for a stock’s required return). Disagreements over the “right” discount rate can stall analysis.
IRR circumvents this by finding the exact rate at which a stock’s future cash flows (dividends plus expected sale price) equal the current price. You then simply compare the IRR to your personal or firm’s required rate of return (hurdle rate).
Maintaining Analytical Rigor
IRR doesn’t abandon the time value of money; it’s still grounded in DCF logic. The difference is that the discount rate is derived endogenously, rather than chosen exogenously.
The same data you’d use to forecast dividends, potential share price growth, or other cash flows feed into the IRR calculation, so the methodology remains robust.
Practical Investment Insight
Many investors naturally think in terms of annualized returns. IRR aligns with the conventional “percentage return” mindset: “If I buy Stock X today and follow these cash flow assumptions, I’d earn around Y% per year.”
This intuitive clarity aids faster decision-making and helps investors benchmark stocks against alternative opportunities (e.g., bonds, index funds, or other equities).
Final Takeaway
Shifting your focus from traditional NPV-based (discounted cash flow) valuations to IRR for stocks can simplify comparisons across different equities. You get a clear, percentage-based return metric that is both intuitive to interpret and rigorous in reflecting time-value-of-money principles. As always, ensure that the underlying cash flow estimates—dividends, selling price, growth rates—are realistic and benchmarked against real-world data. By doing so, IRR becomes a powerful, comparable measure of investment attractiveness.
Share your thoughts on this topic in the comments below!
Found the google sheets! Thanks for your quick reply and keep up the great work 🙌
Thank you for the insights, IRR seems to get around at least some of the wrong assumptions of the DCF.